plot_series_with_profiles
- plot_series_with_profiles(ts, profiles, true_cps=None, found_cps=None, score_name='ClaSP Score', title=None, font_size=16)[source]
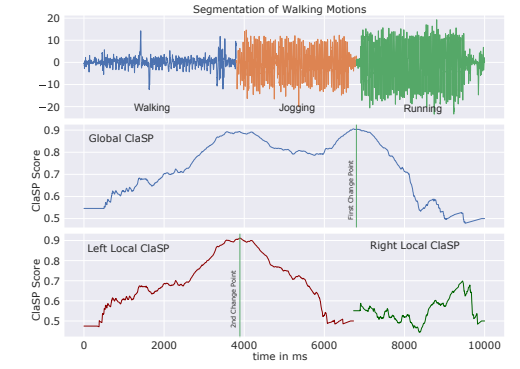
Plot the TS with the known and found change points and profiles.
- Parameters:
- ts: array-like, shape=[n]
the univariate time series of length n to be annotated. the time series is plotted as the first subplot.
- profiles: array-like, shape=[n-m+1, n_cpts], dtype=float
the n_cpts profiles computed by the method used the profiles are plotted as subsequent subplots to the time series.
- true_cps: array-like, dtype=int, default=None
the known change points. these are highlighted in the time series subplot as vertical lines
- found_cps: array-like, shape=[n_cpts], dtype=int, default=None
the found change points these are highlighted in the profiles subplot as vertical lines
- score_name: str, default=”ClaSP Score
name of the scoring method used, i.e. ‘ClaSP’
- title: str, default=None
the name of the time series (dataset) to be annotated
- font_size: int, default=16
for plotting
- Returns:
- figmatplotlib.figure.Figure
Figure with 1 + len(profiles) subplots, one for the time series and others for each profile
- axesnp.ndarray
Array of the figure’s Axe objects