Distance based time series classification in aeon
Distance based classifiers use a time series specific distance function to measure the similarity between time series. Time series distance functions are often called elastic distances, since they compensate for possible misalignment between series by shifting or editing the series.
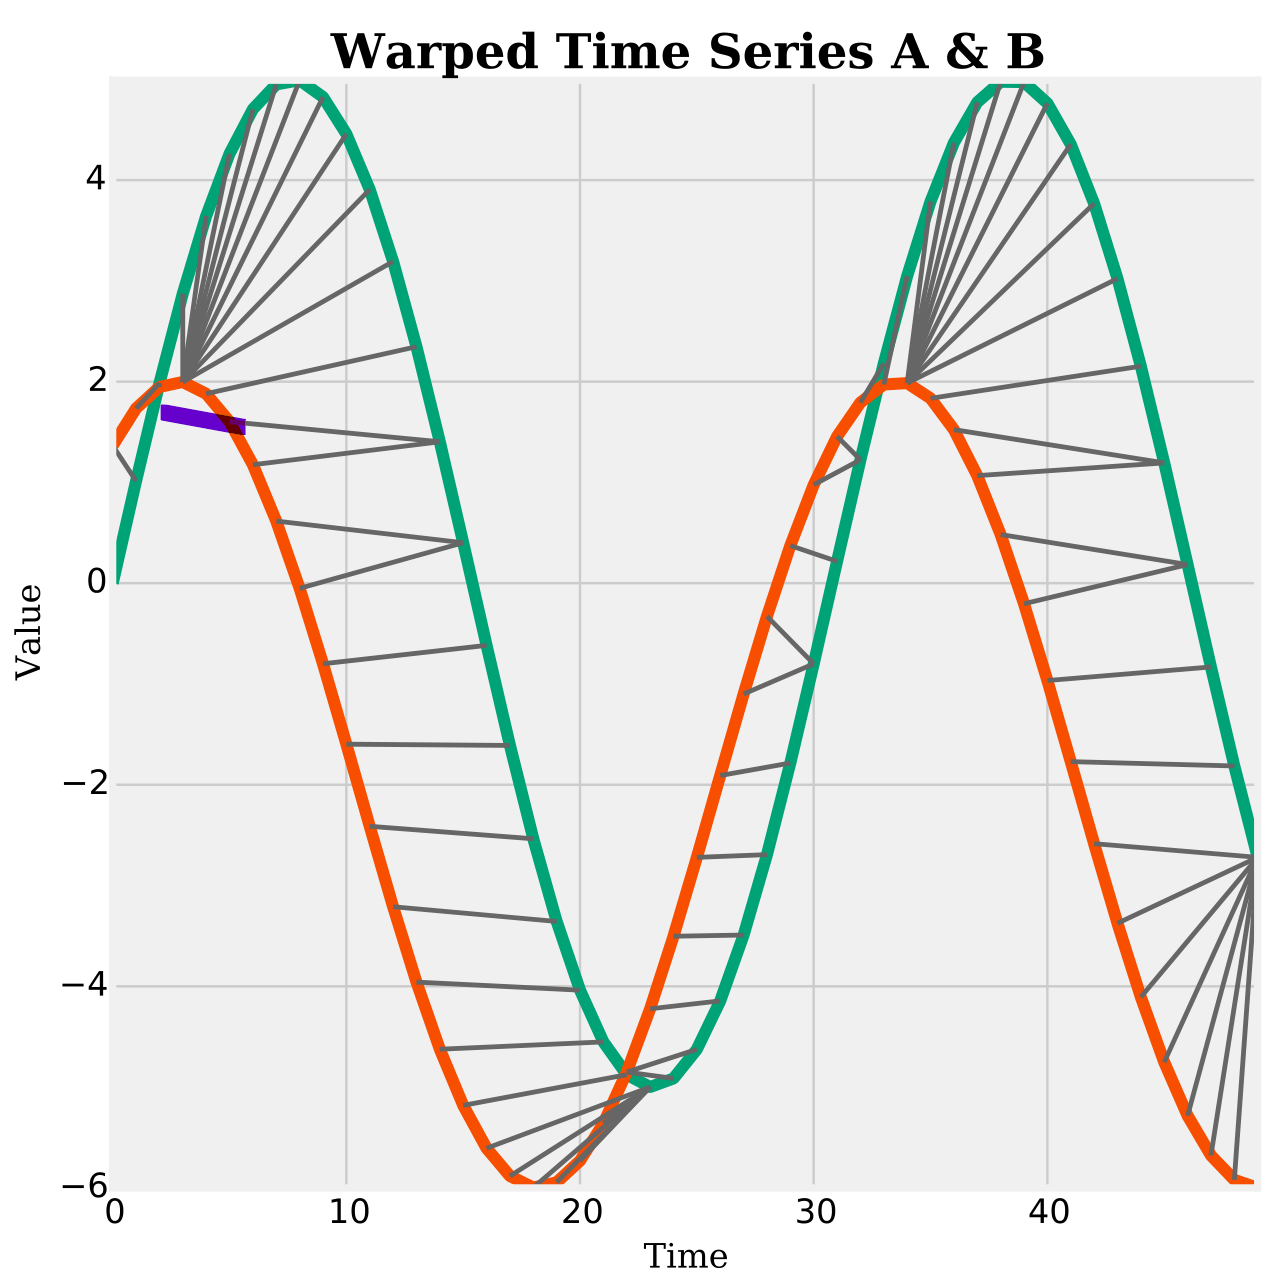
Dynamic time warping is the best known elastic distance measure. This image demonstrates how a warping path is found between two series 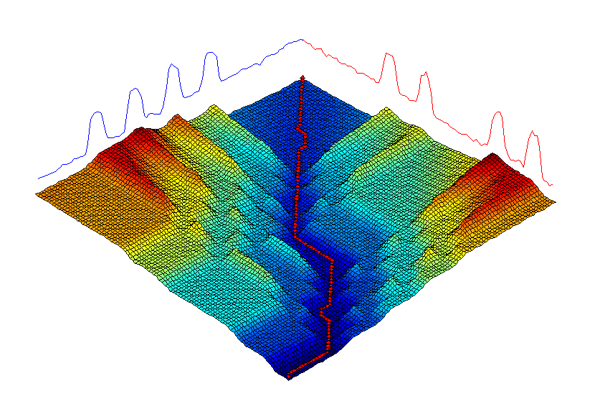
We have a range of elastic distance functions in the distances module. Please see the distance notebook for more information. Distance functions have been mostly used with a nearest neighbour (NN) classifier, but you can use them with sklearn and aeon distances
Load data and list distance based classifiers
[1]:
from sklearn import metrics

from aeon.datasets import load_italy_power_demand
from aeon.utils.discovery import all_estimators

all_estimators("classifier", tag_filter={"algorithm_type": "distance"})
D:\Python\Project\Aeon\aeon\aeon\base\__init__.py:24: FutureWarning: The aeon package will soon be releasing v1.0.0 with the removal of legacy modules and interfaces such as BaseTransformer and BaseForecaster. This will contain breaking changes. See aeon-toolkit.org for more information. Set aeon.AEON_DEPRECATION_WARNING or the AEON_DEPRECATION_WARNING environmental variable to 'False' to disable this warning.
  warnings.warn(
[1]:
[('ElasticEnsemble',
  aeon.classification.distance_based._elastic_ensemble.ElasticEnsemble),
 ('KNeighborsTimeSeriesClassifier',
  aeon.classification.distance_based._time_series_neighbors.KNeighborsTimeSeriesClassifier),
 ('ProximityForest',
  aeon.classification.distance_based._proximity_forest.ProximityForest),
 ('ProximityTree',
  aeon.classification.distance_based._proximity_tree.ProximityTree)]
Distance based classifiers
The data was derived from twelve monthly electrical power demand time series from Italy and first used in the paper “Intelligent Icons: Integrating Lite-Weight Data Mining and Visualization into GUI Operating Systems”. The classification task is to distinguish days from Oct to March (inclusive) from April to September.
The dataset consists of 1096 rows in total. Each row represents a day of Italys electric power consumption. All days have a label either 1 or 2. 67 rows are used for training and the rest are for testing.
[2]:
X_train, y_train = load_italy_power_demand(split="train")
X_test, y_test = load_italy_power_demand(split="test")
print(X_train.shape, y_train.shape, X_test.shape, y_test.shape)
(67, 1, 24) (67,) (1029, 1, 24) (1029,)
[3]:
import matplotlib.pyplot as plt
import numpy as np

fig, axs = plt.subplots(2, 2, figsize=(8, 6))
axs[1, 1].axis("off")
axs[1, 0].axis("off")
ax_combined = fig.add_subplot(2, 1, (2, 3))
axs[0, 0].set_title("All days class 1")
axs[0, 1].set_title("All days class 2")
ax_combined.set_title("Both classes on top of each other")
for i in np.where(y_test == "1")[0]:
    axs[0, 0].plot(X_test[i][0], alpha=0.1, color="cornflowerblue", linestyle="solid")
    ax_combined.plot(X_test[i][0], alpha=0.1, color="cornflowerblue", linestyle="--")
for i in np.where(y_test == "2")[0]:
    axs[0, 1].plot(X_test[i][0], alpha=0.1, color="orange", linestyle="solid")
    ax_combined.plot(X_test[i][0], alpha=0.1, color="orange", linestyle=":")

[4]:
from aeon.classification.distance_based import (
    ElasticEnsemble,
    KNeighborsTimeSeriesClassifier,
    ProximityForest,
)
K-NN: KNeighborsTimeSeriesClassifier in aeon
k-NN is often called a lazy classifier, because there is little work done in the fit operation. The fit operation simply stores the training data. When we want to make a prediction for a new time series, k-NN measures the distance between the new time series and all the series in the training data and records the class of the closest k train series. The class labels of these nearest neighbours are used to make a prediction: if they are all the same label, then that is the prediction. If they differ, then some form of voting mechanism is required. For example, we may predict the most common class label amongst the nearest neighbours for the test instance.
KNeighborsTimeSeriesClassifier in aeon is configurable to use any of the distances functions in the distance module, or it can be passed a bespoke callable. You can set the number of neighbours and the weights. Weights are used in the prediction process when neighbours differ in class values. By default all neighbours have an equal vote. There is an option to weight by distance, meaning closer neighbours have more weight in the vote.
[5]:
knn = KNeighborsTimeSeriesClassifier(distance="msm", n_neighbors=3, weights="distance")
knn.fit(X_train, y_train)
knn_preds = knn.predict(X_test)
metrics.accuracy_score(y_test, knn_preds)
[5]:
0.9543245869776482
Elastic Ensemble: ElasticEnsemble in aeon
The first algorithm to significantly out perform 1-NN DTW on the UCR data was the Elastic Ensemble (EE) [1]. EE is a weighted ensemble of 11 1-NN classifiers with a range of elastic distance measures. It was the best performing distance based classifier in the original bake off [3]. Elastic distances can be slow, and EE requires cross validation to find the weights of each classifier in the ensemble. You can configure EE to use specified distance functions, and tell it how much.
[6]:
ee = ElasticEnsemble(
    distance_measures=["dtw", "msm"],
    proportion_of_param_options=0.1,
    proportion_train_in_param_finding=0.3,
    proportion_train_for_test=0.5,
)
ee.fit(X_train, y_train)
ee_preds = ee.predict(X_test)
metrics.accuracy_score(y_test, ee_preds)
[6]:
0.9552964042759962
Proximity Forest
Proximity Forest [2] is a distance-based ensemble of decision trees. It was the best performing algorithm in the 2024 bakeoff [4]. It creates an ensemble of decision trees, where the splits are based on the similarity between time series measured using various parameterised distance measures. The current algorithm is implemented to work for univariate, equal-length time-series data.
[7]:
forest = ProximityForest(n_trees=20, n_splitters=5, max_depth=10)
forest.fit(X_train, y_train)
forest_preds = forest.predict(X_test)
metrics.accuracy_score(y_test, forest_preds)
[7]:
0.9591836734693877
Performance on the UCR univariate datasets
You can find the dictionary based classifiers as follows.
[8]:
from aeon.utils.discovery import all_estimators

est = ["ElasticEnsemble", "KNeighborsTimeSeriesClassifier", "ProximityForest"]
for c in est:
    print(c)
ElasticEnsemble
KNeighborsTimeSeriesClassifier
ProximityForest
[9]:
from aeon.benchmarking.results_loaders import get_estimator_results_as_array
from aeon.datasets.tsc_datasets import univariate

names = [t.replace("Classifier", "") for t in est]

results, present_names = get_estimator_results_as_array(
    names, univariate, include_missing=False
)
results.shape
[9]:
(112, 3)
[10]:
from aeon.visualisation import plot_boxplot, plot_critical_difference

plot_critical_difference(results, names)
[10]:
(<Figure size 600x220 with 1 Axes>, <Axes: >)

[11]:
plot_boxplot(results, names, relative=True)
[11]:
(<Figure size 1000x600 with 1 Axes>, <Axes: >)

References
[1] Lines J and Bagnall A (2015) Time series classification with ensembles of elastic distance measures. Data Mining and Knowledge Discovery 29:565–592 https://link.springer.com/article/10.1007/s10618-014-0361-2
[2] Lucas et al. (2019) Proximity Forest: an effective and scalable distance-based classifier. Data Mining and Knowledge Discovery 33: 607–635 https://arxiv.org/abs/1808.10594
[3] Bagnall et al. (2017) The great time series classification bake off: a review and experimental evaluation of recent algorithmic advances Data mining and knowledge discovery 31: https://link.springer.com/article/10.1007/S10618-016-0483-9
[4] Middlehurst et al. (2024) Bake off redux: a review and experimental evaluation of recent time series classification algorithms. Data mining and knowledge discovery 38: https://link.springer.com/article/10.1007/s10618-024-01022-1
Generated using nbsphinx. The Jupyter notebook can be found here.
![]()